Transaction Report
Transaction Report is a feature to view and analyze transaction data within a specific period.
Transaction Report Purpose
This feature helps users to:
- View transaction charts for a specific period.
- Know the total transactions that occurred within a specific date range.
- Compile transaction reports for further analysis.
- Provide transaction data that can be exported for further needs.
Transaction Report View
Transaction Report Chart
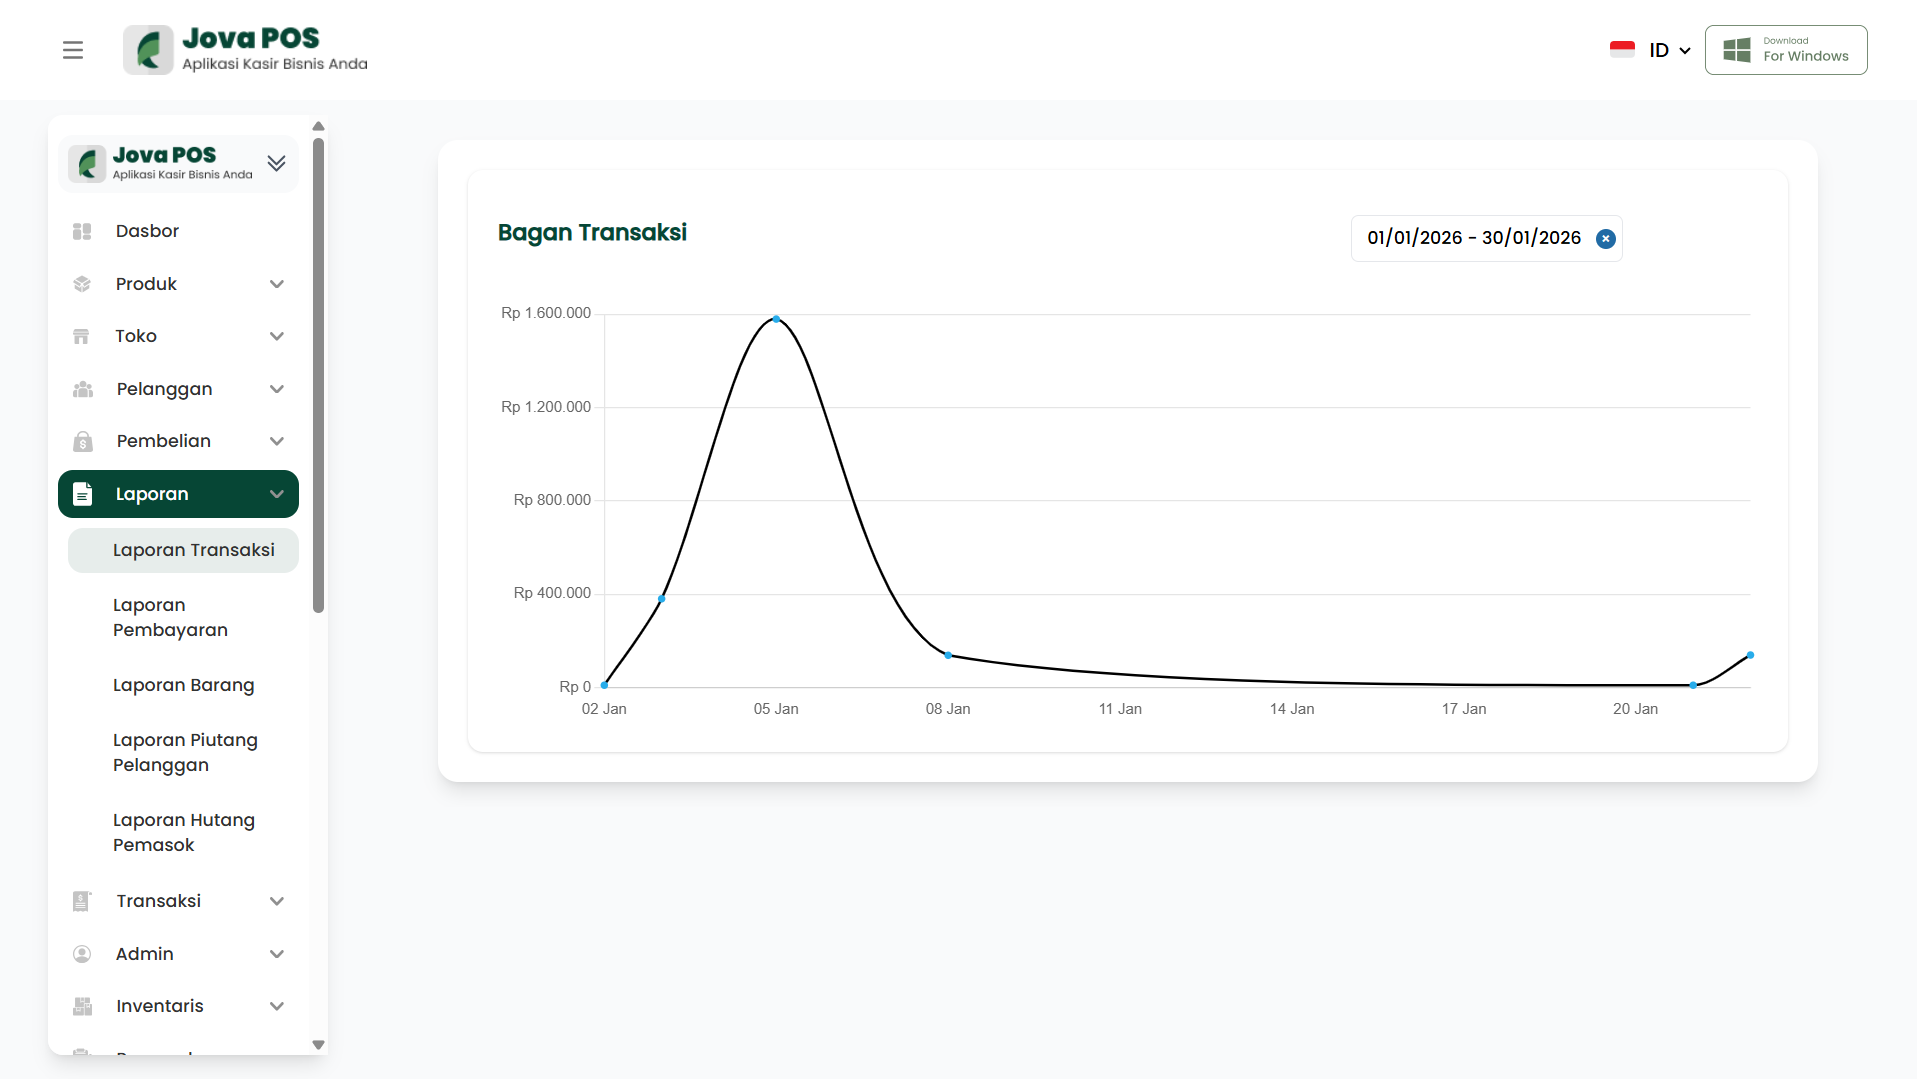
On the Transaction Report page, you will see a chart showing the number of transactions that occurred throughout the selected period. This chart provides a visual overview of transaction trends, which can be used for further analysis.
Filtering Reports by Date
You can select the time period you want to view by choosing the appropriate date range. After selecting the date range, the chart will update to show transaction data according to that period.
- Select the desired dates in the Start Date and End Date fields.
- Click Apply to filter the transaction data.
Conclusion
By using the Transaction Report feature, you can easily monitor your business transaction performance, analyze sales trends, and conduct evaluations based on available data.